You no longer need to configure a report or export to Excel. With Claude Desktop and the Ledger Botje connection you simply ask: “Build me a report on …” and you get a clear dashboard back, built from your own Exact Online data. This article shows how it works using two examples.
What you need
- Claude Desktop — the free app from Anthropic.
- A Ledger Botje connection to your Exact Online (14-day free trial).
That is all. Once the MCP server is added, Claude can query your administration. See the MCP setup guide for how to connect.
Example 1: goods deliveries per week
You start with a simple question: “Build me a report on the number of goods deliveries per week.” Claude switches on Ledger Botje’s logistics tools and starts digging.
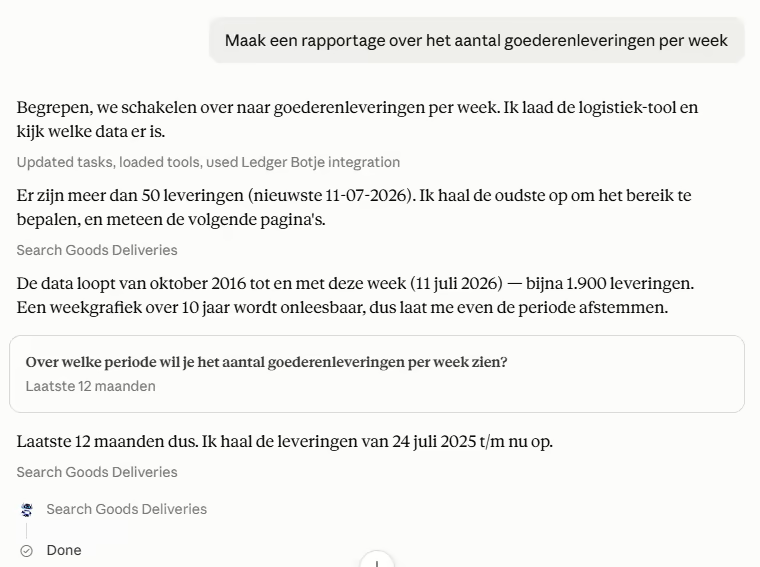
Notice what happens: Claude discovers there are almost 1,900 deliveries in the administration, going all the way back to 2016. Rather than turning that into an unreadable ten-year chart, it first checks what you actually want to see — and you pick “the last 12 months”. That one clarifying question saves you a report that makes no sense.
The result is a complete dashboard:
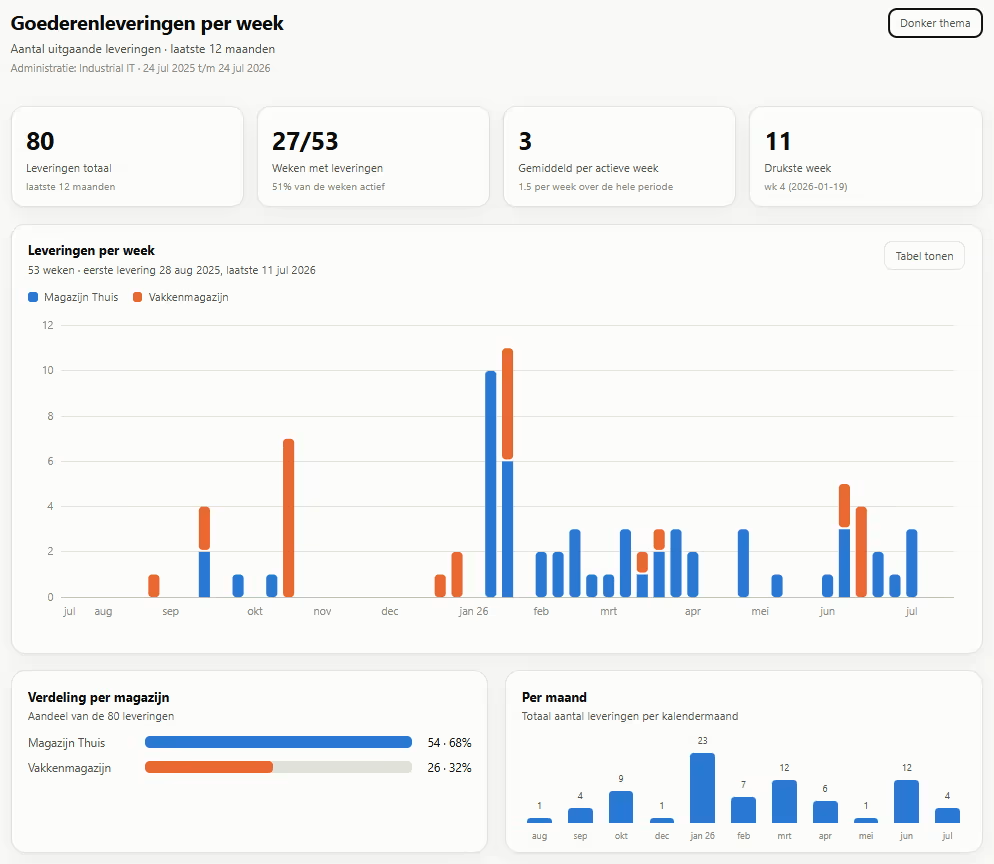
At the top the headline figures (number of deliveries, busiest week, average per active week), below that a weekly chart broken down by warehouse, and at the bottom the split per warehouse and per month. Everything is interactive: click “Show table” for the underlying figures, or switch to a dark theme.
Example 2: your shop orders in production
Do you work with production? Then ask, for instance: “Give me an overview of my shop orders for this quarter.” Claude turns it into a production dashboard:
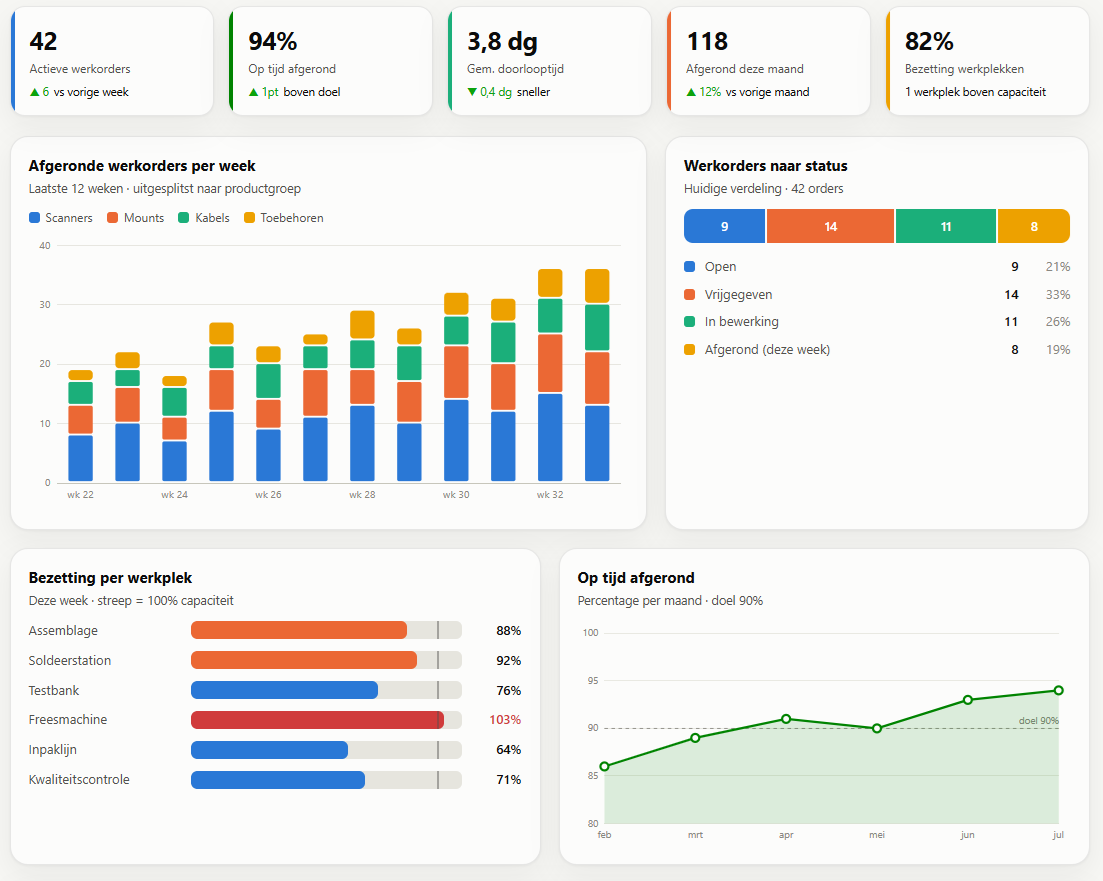
Here you see at a glance how many shop orders are active, how many were completed on time, the average lead time and the utilisation per work centre. The status split (open, released, in progress, completed) and an “on-time completion” trend line against your target complete the picture — exactly the overview you would otherwise click through several screens in Exact Online to assemble.
What makes this different from a standard report?
- You ask in plain language. No filters to set, no columns to pick — you just describe what you want to know.
- Claude thinks along. As in the first example: if a question is too broad, it scopes it down with you instead of producing something useless.
- You get a living dashboard, not a dead export. Ask for a different period, an extra product group or an added chart, and it adapts within the conversation.
What else can you report on?
Almost anything that is in your Exact Online. A selection:
- Revenue per month, compared with last year.
- Outstanding invoices, broken down by age.
- Your largest customers or suppliers over a period.
- Stock and stock value per warehouse.
- Written hours and overruns per project.
You will find more ideas in our prompt library.
Tips for a useful report
- Bound the period. “This quarter” or “the last 12 months” gives a more readable picture than “everything”.
- Name the dimension. Per week, per month, per warehouse, per customer — say what you want to break it down by.
- Keep asking. See an outlier? Ask Claude to zoom in on that week or that project.
- Ask for a table if you want to work on with the exact figures.
Is this safe?
Yes. The connection is read-only by default: Claude reads and reports, but posts nothing unless you enable that per user. The connection runs over encrypted OAuth and you revoke access with a single click. And because the figures come straight from your administration, Claude makes nothing up — it shows what is really there. Read more in the security explainer.
How do you start?
- Connect Ledger Botje to your Exact Online (OAuth consent, one click).
- Add the MCP server in Claude Desktop.
- Ask: “Build me a report on …” — done.
Frequently asked questions
What do I need to build reports with Claude?
Claude Desktop (the free app from Anthropic) and a Ledger Botje connection to your Exact Online. Nothing else: you ask for the report in plain language and Claude fetches the figures itself.
Can I adjust or export the report?
Yes. You ask Claude for a different period, an extra breakdown or a dark theme, and the dashboard adapts within the conversation. You can show it as a table or request the underlying figures.
Is the data in the report reliable?
The figures come straight from your Exact Online via Ledger Botje (as of the last synchronisation). Claude does not make anything up; it reports what is in your administration.
Does this work with other AI assistants too?
Yes, the connection also works with ChatGPT, Copilot, Gemini and others. This article uses Claude Desktop because it shows visual dashboards right inside the conversation.
Ready to see your own figures like this? Try Ledger Botje free for 14 days, connect your Exact Online and let Claude build your first report today.